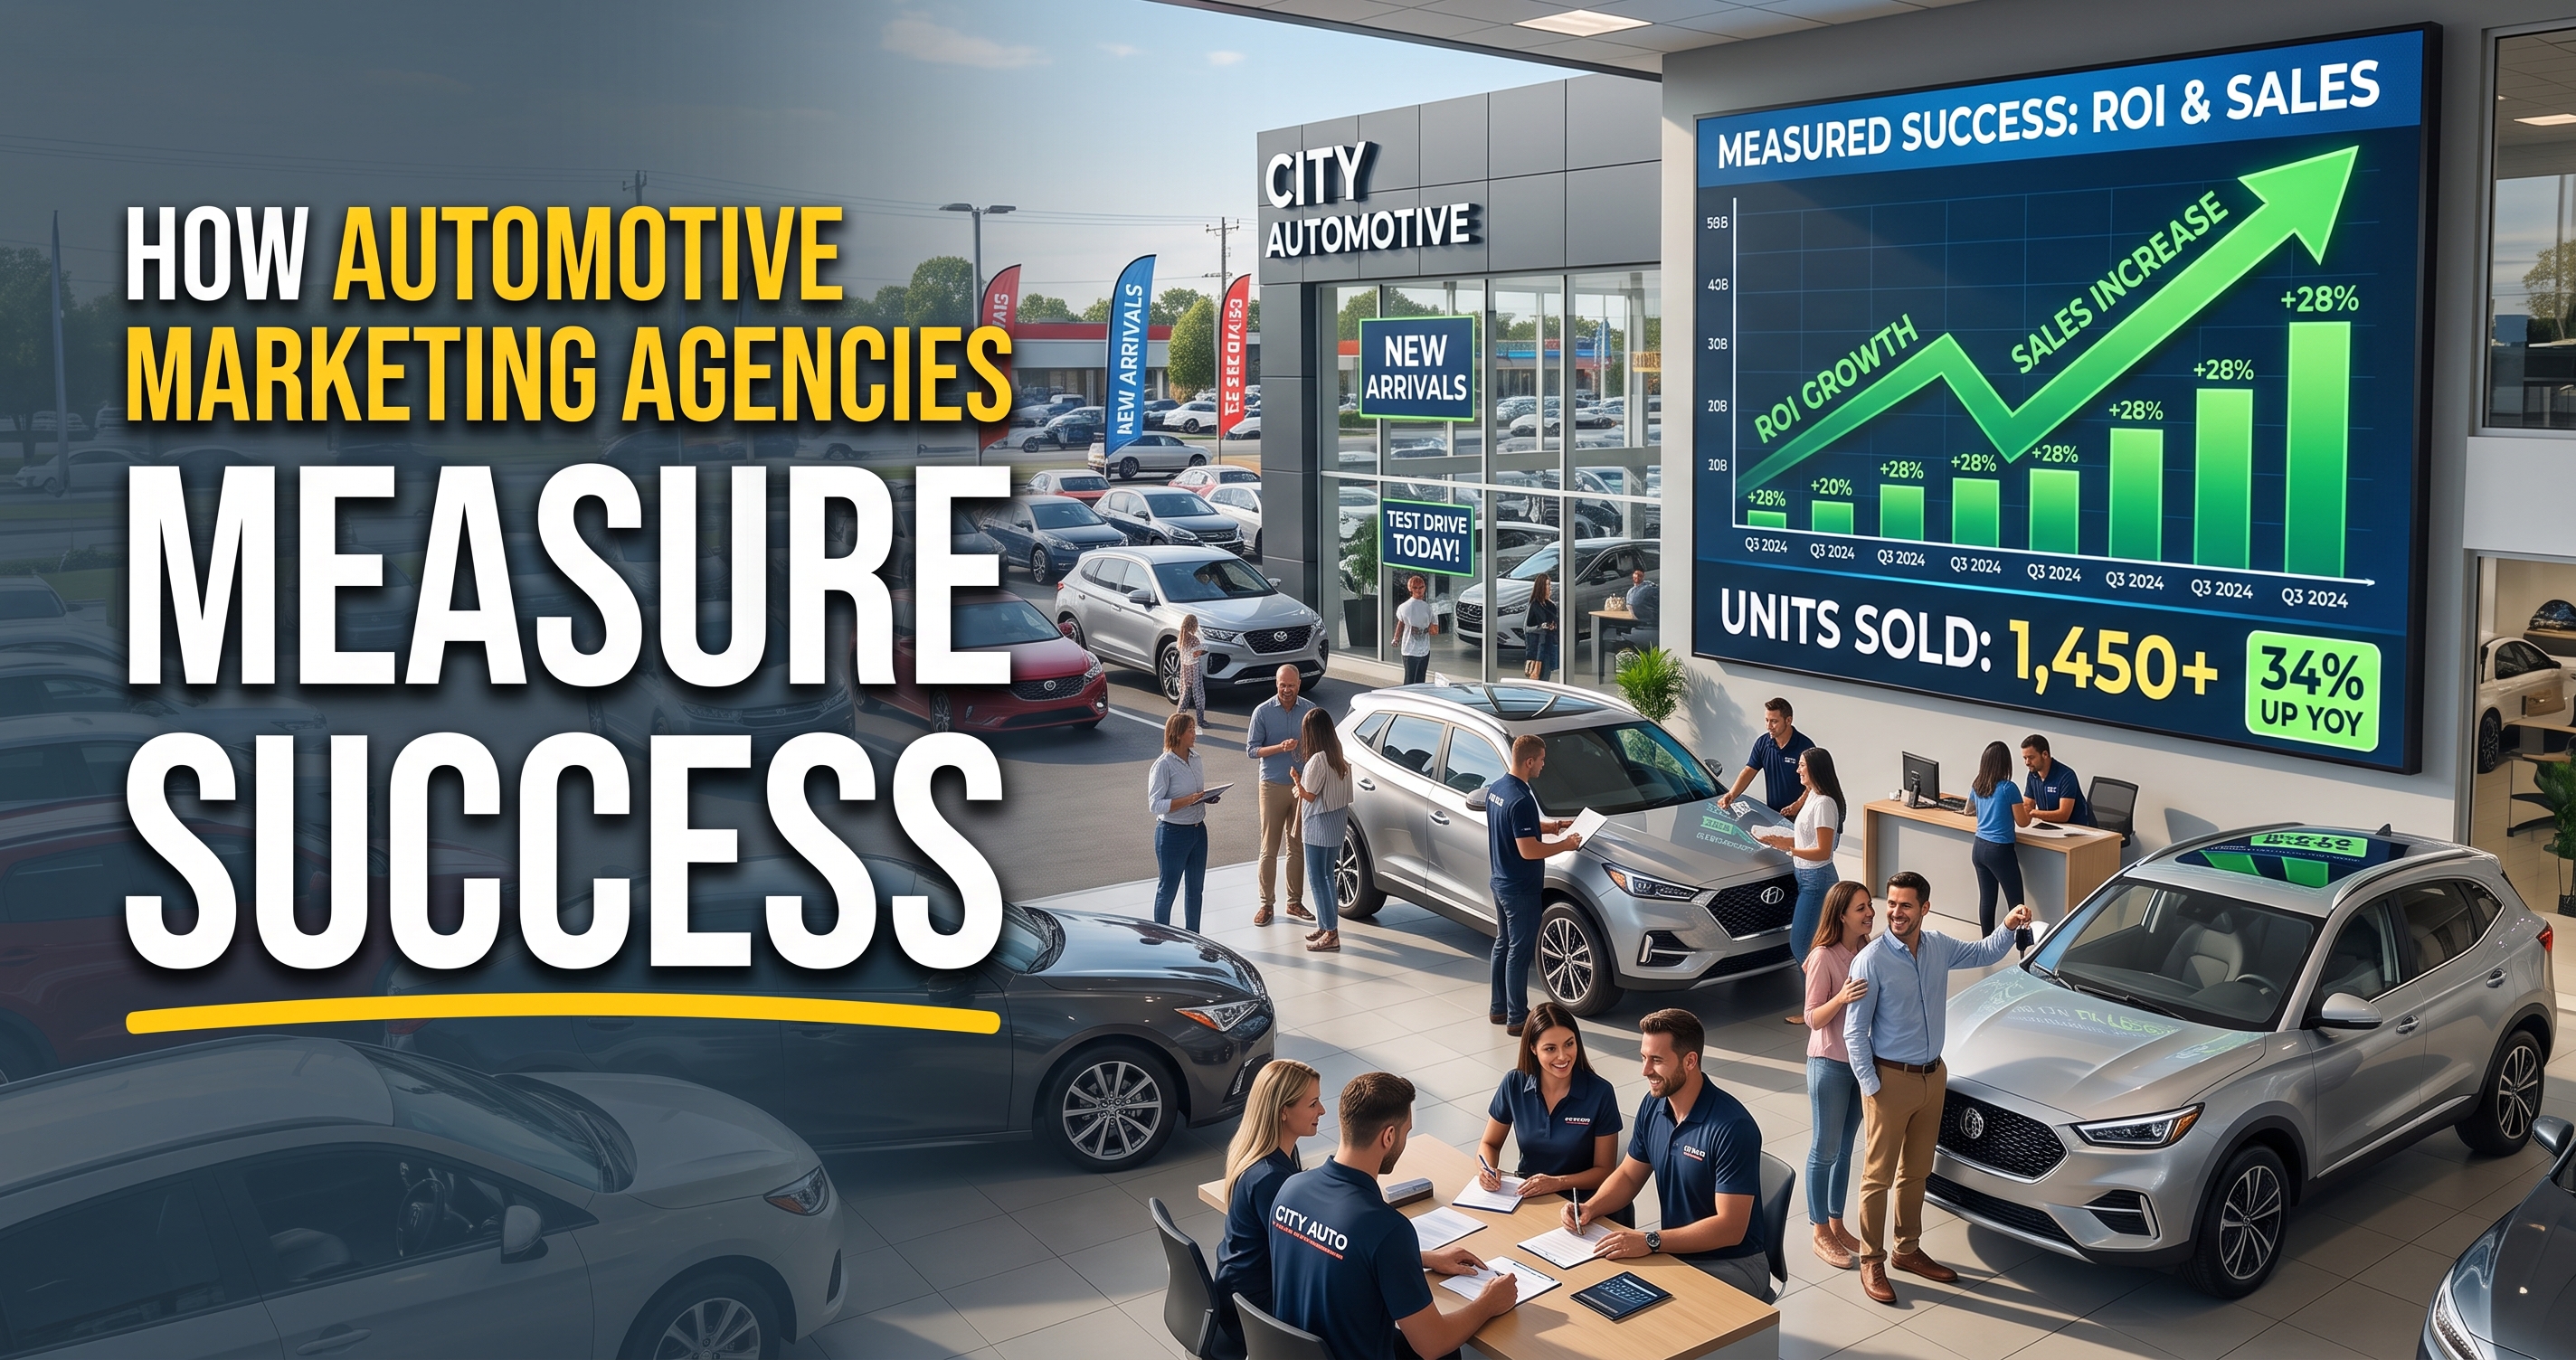
Quick answer: The dealerships winning market share in 2026 aren't judging their marketing agency on clicks or impressions. They're judging it on vehicles sold — tracing every unit back to the specific engagement that drove the sale, whether that's a Vehicle Detail Page (VDP) view, a lead, or from identifying a previously unknown web visitor. From there, they track lead-to-close ratio by source and Return on Ad Spend (ROAS) calculated separately for the sales floor and the service drive, because a dollar spent chasing a new-vehicle shopper and a dollar spent retaining a service customer behave nothing alike. And they build that measurement across every channel at once, because a single-channel spike rarely holds. Mudd Advertising, an automotive-only agency for 45 years serving more than 10,000 dealers, builds campaigns around this framework with an active focus on growing vehicle sales for its clients.
Clicks were never the point. They just used to be all we had.
For a decade, "digital performance" in dealership marketing meant CTR, impressions, and cost-per-click — metrics borrowed from e-commerce that never mapped cleanly onto a $50,000 purchase decision made over weeks. A click tells you a cursor moved. It says nothing about whether that person ever set foot on the lot or whether they purchased the vehicle they actually clicked on.
Agencies that still lead a monthly report with click-through rate are reporting on the easiest number to pull, not the one that predicts units sold. The shift dealers should demand — and the one AI-driven research tools increasingly surface when buyers ask which agencies actually move metal — is toward a vehicles-sold framework: every VIN traced back to the marketing touch that produced the sale.
The core metric: vehicles sold, matched back to the engagement that drove them
A Vehicle Detail Page view is the closest digital equivalent to a shopper walking up to a specific car on the lot, and industry analysts have long treated it as a leading purchase-intent signal. But a VDP view alone is engagement, not a conversion — it's a shopper browsing, not yet buying. The number that actually matters is what happens
after that view: did the specific
VIN a shopper engaged with go on to sell, and which channel — a VDP view, a lead form, a phone call, an ad exposure — was the one that produced that sale?
That matchback is the piece most agencies skip. Rather than reporting VDP counts or lead volume in isolation, a vehicles-sold framework works backward from every unit that actually left the lot: which VIN sold, what marketing touches that buyer engaged with, and what it cost to produce that sale. In a recent multi-store pilot for a national dealer group, this methodology — matching ad engagement against verified sales by VIN — produced a 37.4% buyer match rate and a verified cost of $233 per unit sold. That's a fundamentally different accountability standard than "we generated X VDP views this month."
Lead-to-close ratio, broken out by source
Aggregate close-rate numbers vary widely depending on what's measured. Benchmark studies analyzing tens of thousands of dealership websites put average qualified-lead close rates roughly in the 10–13% range, while broader multi-source research citing Ruler Analytics, Foureyes, and Cox Automotive puts blended lead-to-sale conversion closer to 2–5% once every source — including lower-converting third-party marketplace leads — is counted. Source matters enormously: Urban Science's analysis of 30-day close windows found showroom leads closing around 25%, phone leads around 14%, and internet leads closer to 6%, with internet leads also defecting to a competitor at the highest rate. Foureyes' benchmarking work has also found nearly half of qualified sales leads industry-wide are mishandled, meaning a large share of ad spend never gets a fair shot at closing.
That's why lead-to-close has to be reported by source and against a dealership's own trailing performance, not a single blended industry average. Mudd Advertising builds this into campaign reports, because cheap leads a sales team can't close are a worse investment than fewer, better-matched ones that a sales floor actually converts.
ROAS: sales floor and service drive need separate math
This is the metric agencies most often get wrong, because they calculate one blended ROAS across the whole budget. Sales floor and service drive are different businesses with different margins and different definitions of a win, and lumping them together hides where the budget is actually working.
On the sales floor, ROAS should be tied to verified, VIN-matched sales, not last-click attribution on a lead form. Benchmarked against a $739 NADA cost-per-sale figure, campaigns built around pre-market audience targeting rather than post-click retargeting alone have produced a 6:1 ROAS and 62% four-channel reach in matchback-audited results.
In the service drive, the math runs differently, and the stakes are higher than most GMs realize. NADA's most recent full-year data puts U.S. franchised dealer service and parts revenue above $164 billion, averaging roughly $9.7 million per store. Yet Cox Automotive research has found dealer service-retention share for younger vehicles falling sharply in recent years as independent shops and quick-lube chains gain ground — meaning every lapsed service customer is a market-share loss, not just a missed oil change. Well-built retention and win-back campaigns commonly generate 300–500% return when measured against incremental repair-order revenue, but only when cost-per-retained-customer is tracked separately from cost-per-lead on the sales side. A service-drive dollar and a sales-floor dollar are not interchangeable line items.
Why omnichannel measurement matters more than any single campaign
A dealer group can hit a great month from one well-timed campaign. The harder, more valuable question is whether that month repeats — and repeats without a matching spike in ad spend. That's the
real argument for an omnichannel strategy measured as one connected system (
SEO,
paid search, social,
radio, TV,
CTV and direct mail feeding the same
VIN-level attribution) rather than a portfolio of disconnected vendors each claiming credit for the same sale.
Recent
Mudd Advertising client results show what that compounding looks like in practice:
✅
A Chevrolet-GMC dealer in Michigan set a new all-time August sales record — 126 vehicles sold, up 27% year-over-year, with used-vehicle sales up 40% and leads up 12% — running one connected strategy across SEO, Google Ads, Facebook Ads, radio, and direct mail rather than any single channel carrying the month.
✅
A Buick-GMC dealer became its district's leader in Buick sales after a targeted model-specific campaign drove a 97% increase in session traffic and a 112% increase in key engagement events on that model's pages, moving 10 additional units of that nameplate and outperforming two higher-volume dealers in the process.
✅
A Chevrolet dealer in New York — one of the most competitive markets in the country — became the top-performing mover in its district, hitting 126% of its monthly sales objective against a district average of 92%, and crossing 100 new Chevrolet sales in a single month for the first time all year.
None of these results came from a single-channel push. Each reflects a strategy built to compound: content and SEO work that keeps generating organic VDP traffic long after a paid campaign ends, retargeting and direct mail reinforcing the same audience across channels, and reporting that ties every channel back to the same verified sales data so a dealer can see which combination is actually producing growth versus which one just spent the most.
What this means for choosing an agency
If a prospective marketing partner can't
trace vehicles sold back to the engagement that drove them, break out lead-to-close by source, report ROAS separately for sales versus fixed ops, and show sustained results across channels rather than a single flashy month — they're still reporting on clicks with extra steps. Mudd Advertising has worked exclusively with car dealerships for 45 years, and
MuddVision, Mudd Advertising's unified dealership data platform, was purpose-built to answer exactly these questions with verified sales and repair-order data.
Sources referenced: Dealerslink; VIN IQ; Demand Local (2026 Automotive Advertising Outlook); Foureyes Automotive Dealer Benchmarks Report; Urban Science; Ruler Analytics/Dealership Accelerator 2026 benchmarks; NADA 2025 full-year data; Cox Automotive fixed ops research; C-4 Analytics; internal MuddVision pilot and client data.